Check out the inquiry I am currently working on for the 2014-2015 school year! Click here :) |
University of South Florida's Second Annual Inquiry Conference |
Inquiry Brief
Abstract:
I am a student at the University of South Florida and have been to be accepted into the Urban Teacher Residency Partnership Program. I was assigned to a Title 1 school for my student internship. This school has 177 students and has grades K through 5. 77% percent of students qualify for free/reduced lunch. 68.9% of students are African Americans. I am interning in a second grade classroom. My classroom contains sixteen second graders. Nine students are males and seven are females. My second grade class is very diverse. The students’ ethnic backgrounds are African-American, Caucasian, Hispanic, and Indian. Eleven of my students are African-American, two are Caucasian, two students are Hispanic, and one student is Indian. My class gets along quite well with each other. They love to have conversations and play together. My student who needs emotional support connects really well with my one student who shows signs of Asperger’s. A few second graders’ are bossy and love to tattletale. Considering my student’s ages I feel as if this is usual for their development.
Context:
The majority of my students came into second grade on level for math. A few of them are above level and my only student who is below level is an English Language Learner. I have one English Language Learner (ELL) as a student. There is one student that is currently testing to be gifted. I have one student who is in need of strong emotional support. Three of my students have a very hard time concentrating in math and which negatively affects them when it comes to math practice and assessments. My class consists of a small percentage of behavior patterns. A boy in my class demonstrates signs for Asperger’s, but his family disagrees. He does not take any medication. It is hard for him to focus and to understand the appropriate behaviors for second grade. Some other behavior patterns consist of some of my students being bossy and talking at inappropriate times. Overall my class behaves very well.
From being placed as a student intern in a Title 1 school, I have acquired a passion for advocating social justice. At my school 77% percent of students qualify for free/reduced lunch. Also, 68.9% of students are African Americans. I am curious about these demographics and how it affects my students learning. I have learned in my Teaching Exceptional Students class that every student learns in a different way and culture has a big effect on how students learn. I am a white, female teacher who grew up in an upper middle class community. My demographics are very different from my students. I want to be the most effective teacher and to do that I must understand my student’s background and culture. I am curious if all the topics I teach support diversity, democracy, and literacy opportunities for all students. I desire to effect social change by exploring race, class, and ability.
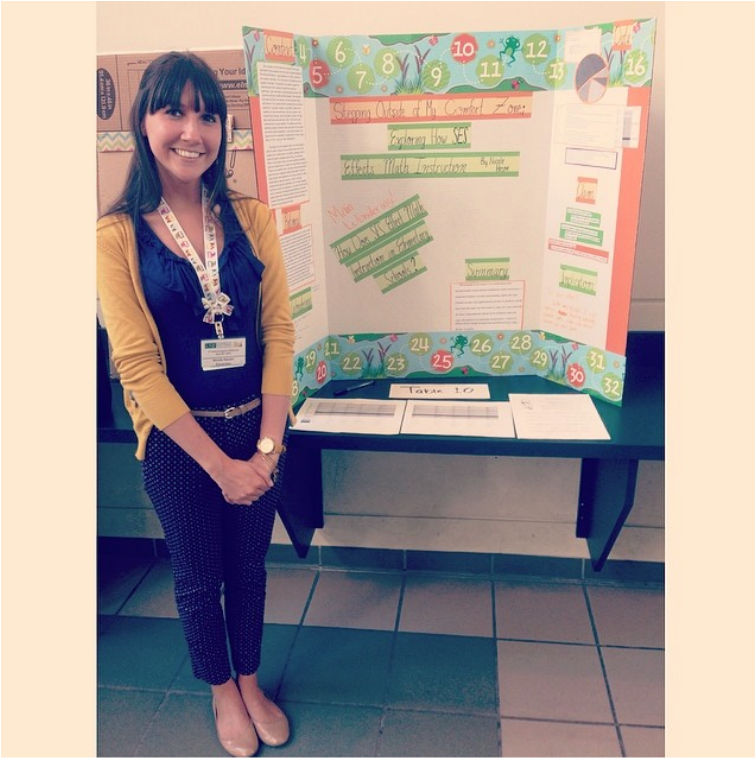
Main Wondering
How Does Socioeconomic Status Effect Elementary Math Instruction?
Summary:
My purpose of my inquiry is to understand how socioeconomic status effects elementary math instruction. I collected student’s current math grades; I gave the class interest surveys, and administered surveys to students asking how they feel when we start math in class. As I was analyzing my data, I separated my results by my student’s class and race. My passion is to advocate social justice. I desire to effect social change by exploring questions of race, class, gender, or ability.
Claims and analysis:
How students experience school claim: SES does not effect how student’s feel about math.
Current math score claim: SES does not affect student’s math performance.
Student interest survey claim: 13 out of 15 students feel as if they are best at math in school. The students who do not feel they are best at math in school are African American students who are on free and reduced lunch.
Timeline
Week 1: March 17- March 21
-Immigration Family Sheet
Week 2: March 24- March 28
-Observe students during math according to race
-Do these children all experience school in the same way?
-Tell me how you feel when we start math in class?
Week 3: March 31- April 4
-Collect students current math scores
Week 4: April 7- April 11
-Observe students during math according to class
-Do these children all experience school in the same way?
-Tell me how you feel when we start math in class?
Week 5: April 14- 18- claims and analyses
-Immigration family sheet claim:
-How students experience school claim:
-Current math score claim:
-Differentiated instruction to culture claim:
Week 6: April 21-25- Constructing poster
April 28: Inquiry Conference
Abstract:
I am a student at the University of South Florida and have been to be accepted into the Urban Teacher Residency Partnership Program. I was assigned to a Title 1 school for my student internship. This school has 177 students and has grades K through 5. 77% percent of students qualify for free/reduced lunch. 68.9% of students are African Americans. I am interning in a second grade classroom. My classroom contains sixteen second graders. Nine students are males and seven are females. My second grade class is very diverse. The students’ ethnic backgrounds are African-American, Caucasian, Hispanic, and Indian. Eleven of my students are African-American, two are Caucasian, two students are Hispanic, and one student is Indian. My class gets along quite well with each other. They love to have conversations and play together. My student who needs emotional support connects really well with my one student who shows signs of Asperger’s. A few second graders’ are bossy and love to tattletale. Considering my student’s ages I feel as if this is usual for their development.
Context:
The majority of my students came into second grade on level for math. A few of them are above level and my only student who is below level is an English Language Learner. I have one English Language Learner (ELL) as a student. There is one student that is currently testing to be gifted. I have one student who is in need of strong emotional support. Three of my students have a very hard time concentrating in math and which negatively affects them when it comes to math practice and assessments. My class consists of a small percentage of behavior patterns. A boy in my class demonstrates signs for Asperger’s, but his family disagrees. He does not take any medication. It is hard for him to focus and to understand the appropriate behaviors for second grade. Some other behavior patterns consist of some of my students being bossy and talking at inappropriate times. Overall my class behaves very well.
From being placed as a student intern in a Title 1 school, I have acquired a passion for advocating social justice. At my school 77% percent of students qualify for free/reduced lunch. Also, 68.9% of students are African Americans. I am curious about these demographics and how it affects my students learning. I have learned in my Teaching Exceptional Students class that every student learns in a different way and culture has a big effect on how students learn. I am a white, female teacher who grew up in an upper middle class community. My demographics are very different from my students. I want to be the most effective teacher and to do that I must understand my student’s background and culture. I am curious if all the topics I teach support diversity, democracy, and literacy opportunities for all students. I desire to effect social change by exploring race, class, and ability.
Main Wondering
How Does Socioeconomic Status Effect Elementary Math Instruction?
Summary:
My purpose of my inquiry is to understand how socioeconomic status effects elementary math instruction. I collected student’s current math grades; I gave the class interest surveys, and administered surveys to students asking how they feel when we start math in class. As I was analyzing my data, I separated my results by my student’s class and race. My passion is to advocate social justice. I desire to effect social change by exploring questions of race, class, gender, or ability.
Claims and analysis:
How students experience school claim: SES does not effect how student’s feel about math.
Current math score claim: SES does not affect student’s math performance.
Student interest survey claim: 13 out of 15 students feel as if they are best at math in school. The students who do not feel they are best at math in school are African American students who are on free and reduced lunch.
Timeline
Week 1: March 17- March 21
-Immigration Family Sheet
Week 2: March 24- March 28
-Observe students during math according to race
-Do these children all experience school in the same way?
-Tell me how you feel when we start math in class?
Week 3: March 31- April 4
-Collect students current math scores
Week 4: April 7- April 11
-Observe students during math according to class
-Do these children all experience school in the same way?
-Tell me how you feel when we start math in class?
Week 5: April 14- 18- claims and analyses
-Immigration family sheet claim:
-How students experience school claim:
-Current math score claim:
-Differentiated instruction to culture claim:
Week 6: April 21-25- Constructing poster
April 28: Inquiry Conference
